Using Curriculum Maps
As discussed extensively in the previous section, there are individual identifiable stages for the process of developing a Curriculum Map and its associated documents. That said the specific intentions and experience of the Curriculum Team developing the Curriculum Map will significantly impact how each step of the process plays out. The needs of the Team determine the specific details of creation. The same is true for the users of a created Curriculum. The same documents may be used by different groups is markedly different ways.
This section will highlight the following
- Based on the Curriculum Mapping Process discussed in the earlier section, types of Compressed Curriculum Maps are discussed here
- The groups of users that can benefit from Curriculum Mapping are also discussed
- Specific use of Curriculum Mapping for different stages of program support at KPU are also discussed here
COMPRESSED CURRICULUM MAPS
Curriculum Mapping at the post-secondary primarily focuses on identifying influence at the supra, macro and meso levels, a while constructing maps and guiding assessment and instructions at the micro and nano levels in large Comprehensive Curriculum Maps. As previously discussed, these Comprehensive Maps are often compressed to purpose, and given the breadth of influencing factors and the diversity of uses, Compressed Curriculum Maps at the Post-Secondary level can take many forms:
See below a summary of what was discussed in the Curriculum Mapping Process section details.
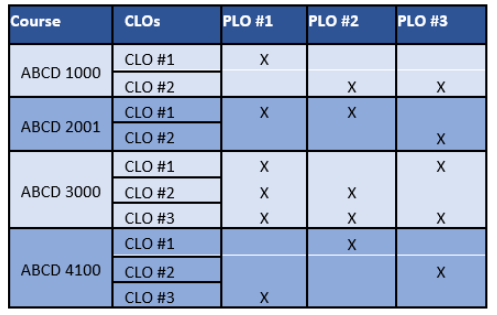
As a reminder, the Basic Map seeks to demonstrate broad curricular alignment. These maps place Program Learning Outcomes at the top of the matrix, and Course Learning Outcomes in the left column of the matrix. Wherever a Course Learning Outcome supports a Program Learning Outcome an “X” or other mark denoting an intersection is created.
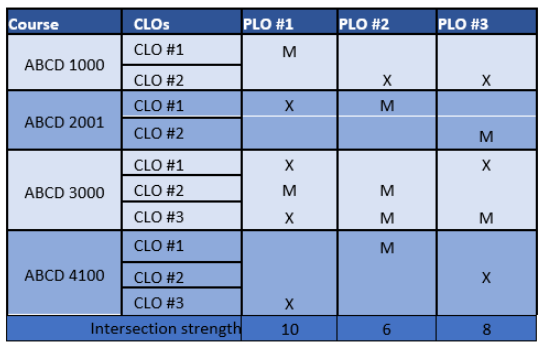
It will then determine if the intersection of the Course Learning Outcome is explicit in its support for the Program Learning Outcome, or implicit in its support. Intersections determined to be explicit remain marked with an “X” and intersections determined to be implicit replace the “X” with an “M”. Finally, each “X” is given two points, and each “M” is given one point and the resulting score is a measurement of how well each Program Learning Outcome is supported.
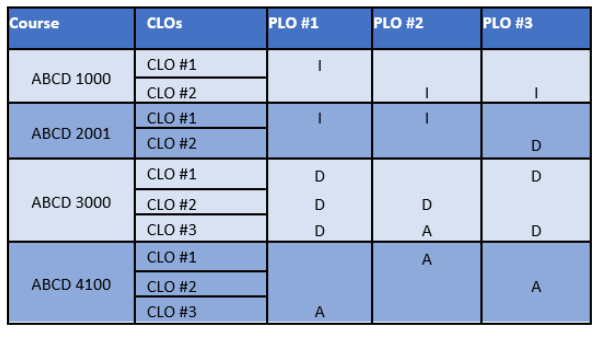
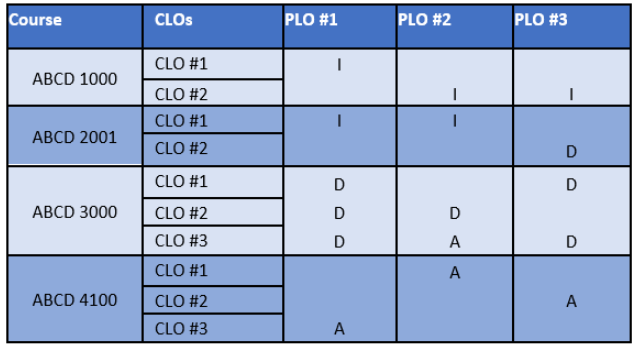
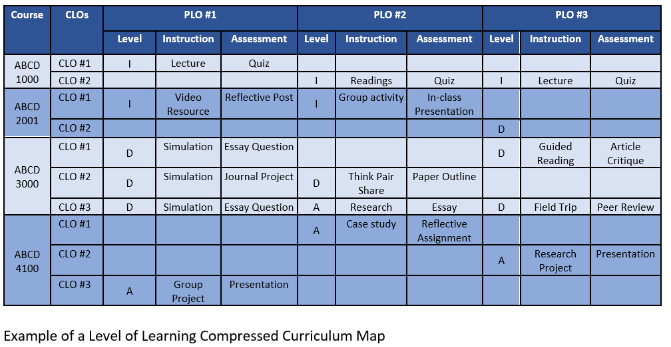
The next step is using the same Program Learning Outcomes as column titles and the same Course Learning Outcomes in the first column, the indicators of intersections are replaced with some form of Evaluation framework. Each of the intersections are assessed for the level of complexity with which the Course Learning Outcomes supports the Program Learning Outcome. The “X” or “M” denoting the intersection is replaced with an “I”, “D” or “A”. Kwantlen Polytechnic University (KPU) currently uses an IDA Evaluation framework, which is an acronym for Introductory, Developing, or Advancing. Each intersection is assessed to see if the Course Learning Outcome is supporting the intersecting Program Learning Outcome at the Introducing, Developing, or Advancing Level, and then changed to represent the appropriate level. Using this system, the Curriculum Team is able to assess Gaps, Redundancies and Misalignments in the Curriculum.
Activity and Assessment Curriculum Maps supplement the information provided by the evaluation framework at the site of intersection with additional columns detailing Assessments and the Instructional Activities to perform well on the assessments.
This approach is more complex and it can provide additional information such as the alignment between assessments or with their outcomes, and learning activities. Determining alignment across so many variables provides a clearer understanding of program requirements for all curriculum users.
To Begin, Curriculum Teams should first determine the purpose for the Content Milestone map. With an understanding of how the map will be used, the team is able to determine the level of detail that needs to be reflected in the map. With this thought out the Curriculum Team is in a position to choose one of the examples provides below, or create a different version that better meets their needs.
Example 1
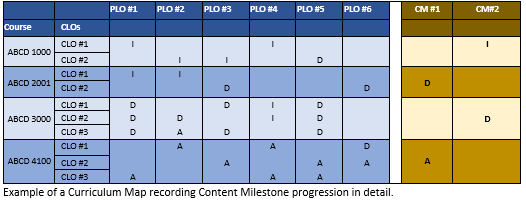
This map allows the Curriculum Team to explicitly measure how well each individual Content Milestone is supported by the Course Learning Outcomes. For Curriculum Teams in this situation the recommendation is that they list each Content Milestone as though it were a Program Learning Outcome, across the top of the Curriculum Map Matrix Document. Once the list is documented, assess each Course Learning Outcome and associated Assessment and Instructional Activity against each Content Milestone to identify intersections. At each intersection where a Course Learning Outcome supports the Content Milestone, place an “X”. With the intersections Identified, assess with the IDA Evaluation Framework replacing each “X” with an “I”, “D”, or “A” as appropriate. Once complete, assess for Gaps, Redundancies and Misalignments.
Example 2
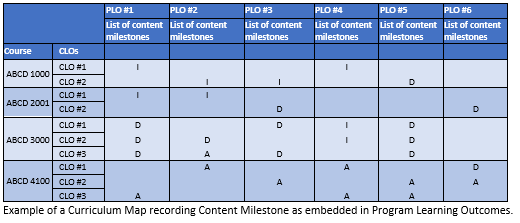
For curriculum teams mapping a very flexible program, a much less detailed approach may be taken. For this less detailed approach, Content Milestones are listed in a cell under the relevant program learning outcome. The idea being that as the program learning outcome is developed so too is the content milestone. The Content Milestone is merely identified but its progress is tied to the progress of the program learning outcome. This row of Content Milestones is considered part of the formal Curriculum Map Matrix Document and is to be included in the map.
Example 3
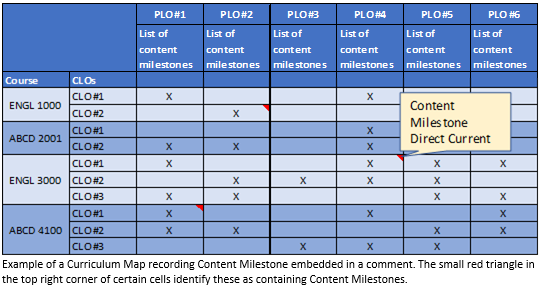
For Curriculum Teams looking for more information without the intensity of the first option, a third approach is possible. This hybrid approach we’ll see the Content Milestones listed underneath the relevant Program Learning Outcome as above. Where it differs is that the Curriculum Team will input the Content Milestone information into the relevant cell of an intersection between a Course Learning Outcome and the relevant Program Learning Outcome. The comment in this cell will identify the Content Milestone being supported. This will provide a visual indication of which Course Learning Outcomes intersecting with Program Learning Outcomes also support the development of Content Milestones.
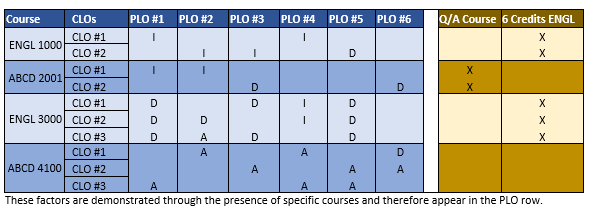
As discussed earlier, many programs will have factors “imposed” on them by outside sources (Chan, Fong, Luk, and Ho, 2017). These Imposed Factors may be directly related to, or completely removed from, the program content. It is important for the Curriculum Team to determine how these imposed factors may be best represented in the Curriculum Map. Once the Curriculum Team has identified how best to account for any Imposed Factors, they may Include them as a distinct component on the Curriculum Map.
Examples:
1. Qualitative / Analytical and 6 Credits of English.
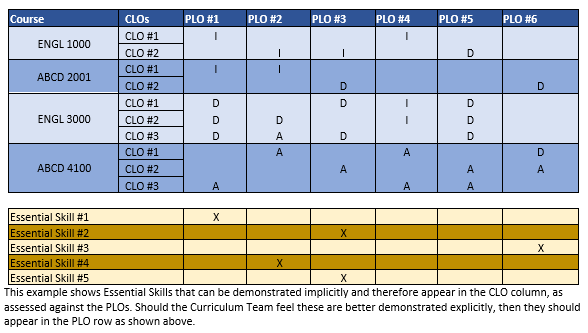
2: Essential Skills
3: Core Program or Foundation
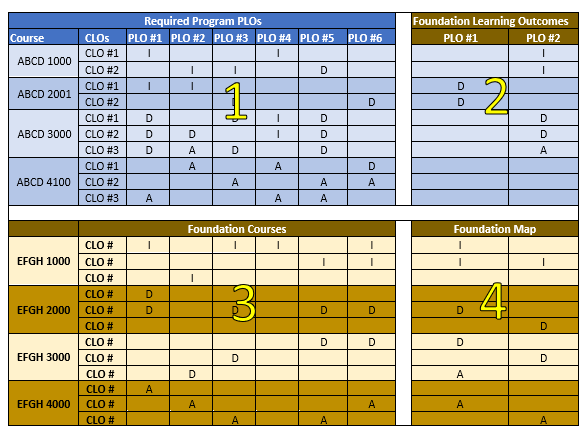
The Curriculum Team will:
- Map the Course Learning Outcomes’ support of the Program Learning Outcomes for the Educational Activity (quadrant 1).
- Input the Program Learning Outcomes for the Core or Foundation program (quadrant 2)
- Input the Course Learning Outcomes for the Core or Foundation program (quadrant 3)
- Plot the Curriculum Map for the Core or Foundation program in the intersection rows and columns (quadrant 4).
While curriculum Maps tend to focus on complex high-level information presented in an attainable matrix document, the same process can be used to clearly illustrate low level detail. Some departments may need some insight into the distribution of content throughout their program. If a course, or selection of courses is proving to be too challenging for learners, as indicated by a uniform and repeatable drop in grades, Curriculum Teams may use this approach to explore and assess the demands on the learners. The Curriculum Team may find that information is not being scaffolded properly, too many new concepts are being introduced at the same time or there is nothing identifiable that is misaligned, rather it is merely a challenging time of the program.
Some departments implementing a very formal and rigid programs that has Lesson Learning outcomes prescribed may choose to create Lesson Learning Outcome Maps. This involves mapping out how the Lesson Learning Outcomes may support the Course Learning Outcomes for a program. This follows the same process as previously described and includes the Course Learning Outcomes as the top row of information. The Lesson Learning Outcomes take the first column. It is important to note that there are around five Course learning Outcomes per course, around thirteen Lesson Learning Outcomes per course, and up to 40 courses for a degree. Planning this for a full degree program would yield a grid of 200 columns for Course Learning Outcomes and 520 Rows for Lesson Learning Outcomes. This is far to big to be manageable. As a result, Curriculum Teams planning to explore this approach may choose to limit themselves to on year of study at a time, (resulting in a grid of 50 x130) or, if this is still too large to be manageable, a single course (resulting in a grid of 5 x 13). Once this is decided, the Curriculum Team will assess for and mark with an “X” the intersections of Lesson Learning Outcomes against Course Learning Outcomes.
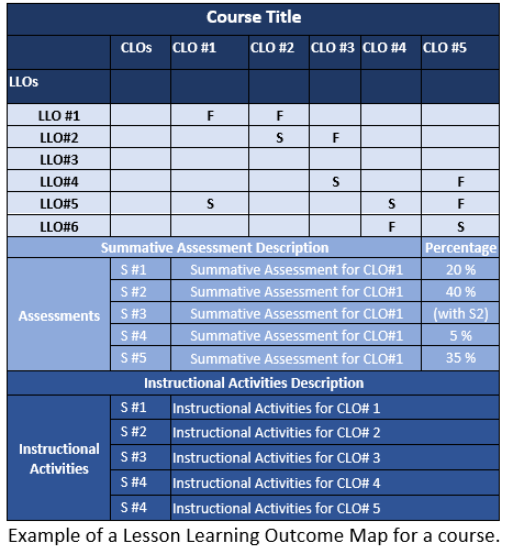
With the intersections identified, the Curriculum Team will determine if the Lesson Learning Outcome is a formative assessment of the intersecting Course Learning Outcome, or a summative assessment. If the intersection is formative, then the “X” is replaced with an “F”, and if the intersection is summative, then the “X” is replaced with an “S”. With the summative assessments identified, the Curriculum Team may note the Assessment percentage in the appropriate column. It is important to note that the use of the word assessment here refers to the summative measurement of the learner’s ability to demonstrate the Course Learning Outcome, that is, this is an opportunity for the Curriculum Team to document the value of the outcome assessment. Generally, it is expected that the assessment of each course learning outcome will be roughly equal. For example, if there are five Course Learning Outcomes, then the assessments for each outcome will be expected to be 20%. There may be situations where the Curriculum Team feels one Course Learning Outcome should be weighted more than the others. This provides an opportunity to document that different weighting and provide a rationale for it. With the Assessments documented, the Curriculum Team can describe the Instructional Activities they recommend to help the learners perform well on the Assessments
This approach to Lesson Mapping can provide significant clarity around Course and Lesson content, how it is assessed and laddered in a course and program. It is very useful for highlighting unusual weightings for the different parts of a single course. The challenges are it is a very unwieldy document given the number of items being intersected, and it is very rigid, requiring prescribed Lesson Learning Outcomes.
User groups
The uses for Curriculum Maps have been discussed, along with the concept of Maps compressed for purpose. Different user groups may also have different need of Curriculum Maps, which may result in unique Compressed Maps.
KPU Specific Uses for Curriculum Mapping
Kwantlen Polytechnic University (KPU) encourages the development and use of Curriculum Maps across the institution. This resource can be seen as a starting point for the development of a consistent KPU Curriculum Mapping Process. There are many applications for Curriculum Maps across the KPU Community; most are voluntary, and others are required in certain situations. This resource will address some of these below.